In case you were curious, here is a breakdown of the Desk’s agency purchases for the month ending November 13, 2013. Units in millions. Data from the Federal Reserve Bank of New York.
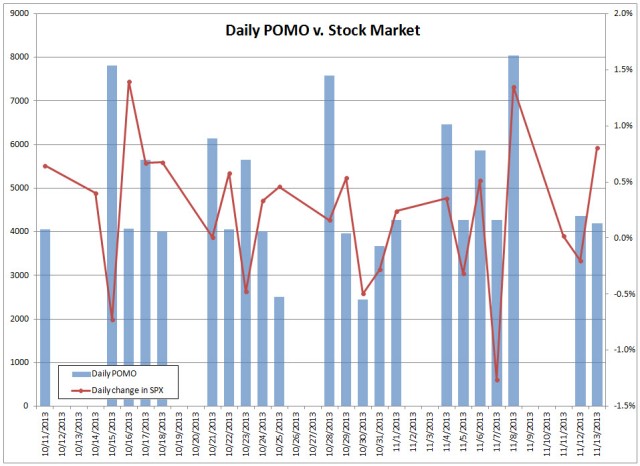
 Agency purchases are pretty steady throughout the month, give or take $200 million. It is roughly $2,600 million per day for 22 days. People say the market goes up on days when the Desk is buying. I don’t see it. This chart shows combined agency and treasury purchases, compared to the daily percentage change in the SP500.

